KUTSUYA
An operations panel for a sneaker store. You log every pair by answering questions instead of filling a spreadsheet, see your profit per pair and build the Instagram stories, all in one place.
Meet the client. Who they are and who they sell to.
The client
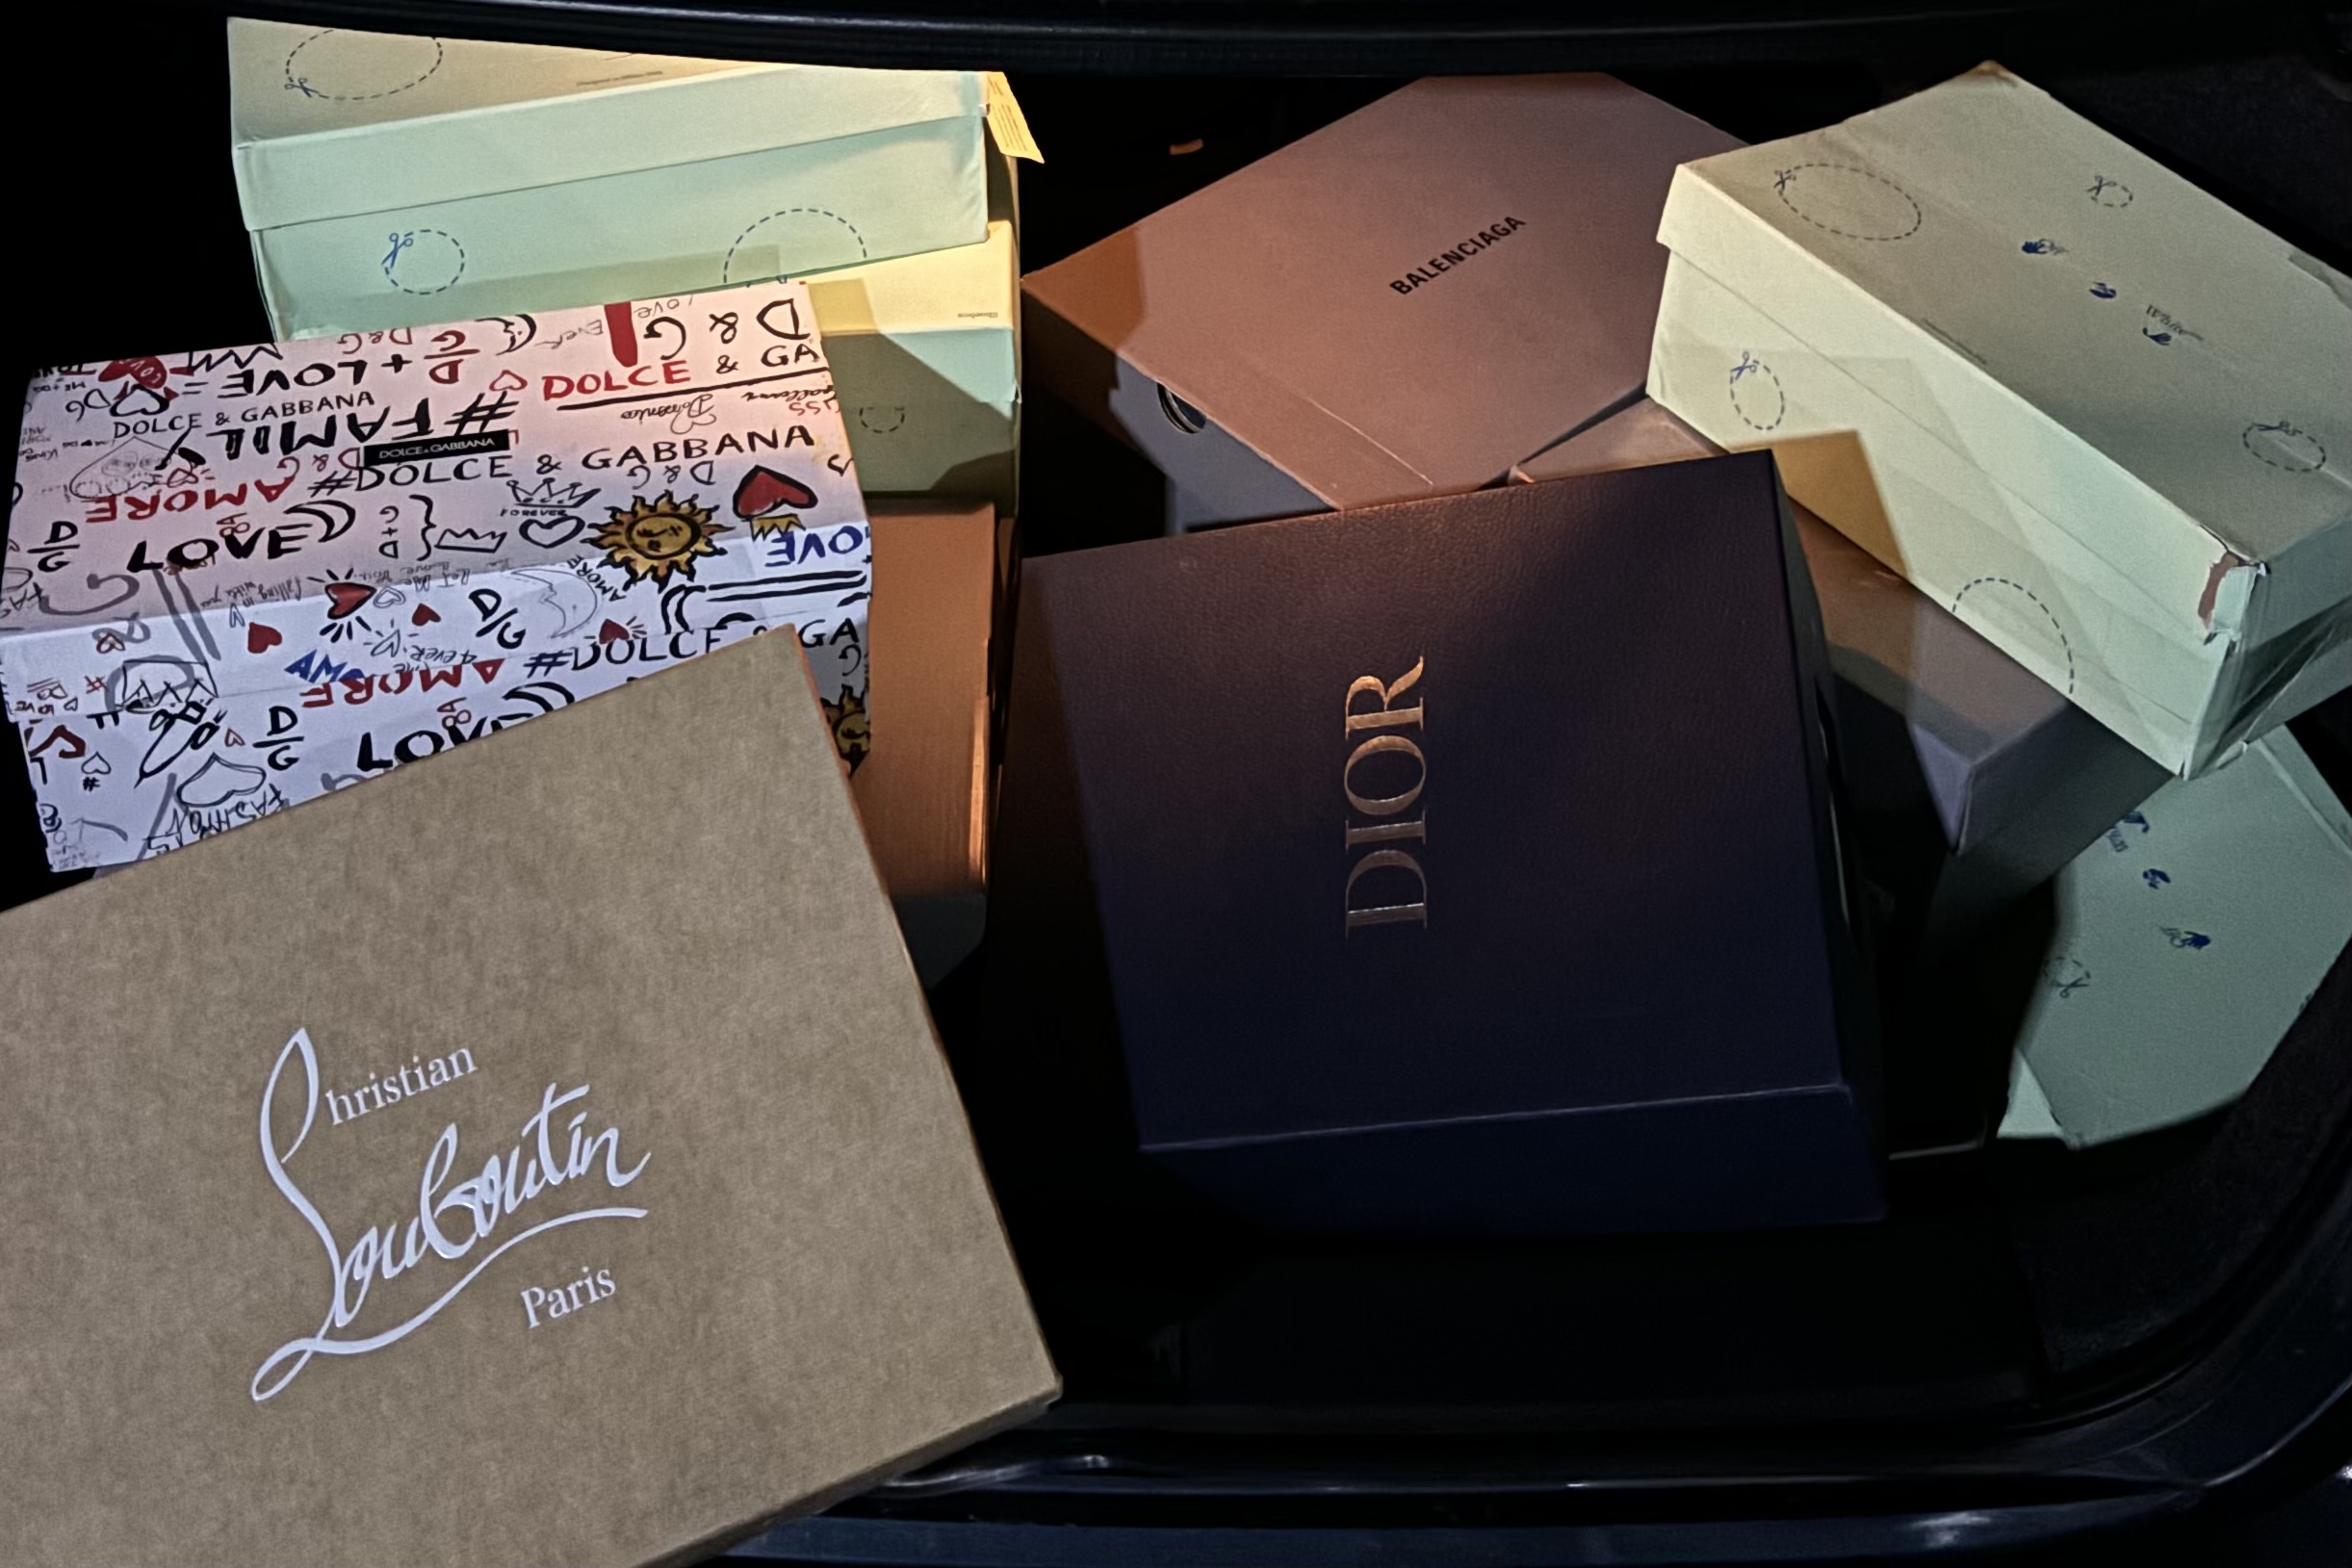
Kutsuya moves designer sneakers in Mexico and sells it all through Instagram. Before, each pair was logged in a spreadsheet field by field and accounting was done by hand; social content was a separate chore. We built their full operations panel. You register each pair by answering questions (paste the link and it fills itself), the system computes cost, profit, margin and ROI per pair, Analytics shows the business, and a generator builds the Instagram stories with the brand ready. No cloud: the data lives on their own machine.
What they came to solve, in plain language.
Challenge
- 01The whole operation in a spreadsheet. Logging each pair field by field was slow and fragile.
- 02Each pair has 10+ fields: brand, model, size, condition, box, purchase, costs, sale, status, payment.
- 03Accounting for profit, margin and invested capital was done by hand, with no clear view of the business.
- 04Instagram content was built separately, disconnected from inventory and the brand.
What changed between day one and launch.
Before & after
ALL IN A SPREADSHEET
- Log each pair field by field in the sheet
- Accounting and margins computed by hand
- No view of profit per pair or capital
- Social content, a separate chore
A CUSTOM PANEL
- Logging via a guided wizard (paste the link and it fills)
- Cost, profit, margin and ROI per pair, automatic
- Business analytics at a glance
- Stories generator with the brand ready, in the same panel
Every feature shaped so the client closes the deal.
What we built
Log by answering, not by spreadsheet
Each pair is logged with a step-by-step wizard: how it comes in, pair details, costs, condition and sale. Paste the GOAT, StockX or Grailed link and it auto-fills; you only answer what's missing. No hunting for the right cell or filling rows by hand.
- Step-by-step wizard with clear questions
- Auto-fill by pasting the pair's link
- You only type what the link doesn't bring
- Per-step validation: nothing closes half-filled
Inventory with per-pair accounting
Every pair carries its purchase, costs (shipping, crossing, extras), sale and status. The panel computes total cost, profit, margin and invested capital on its own, with no manual formulas. You see stock and accounting in the same table.
- Total cost, profit and margin per pair
- Statuses: purchased, available, on hold, sold
- Capital in stock and receivables at a glance
- Own stock vs. made-to-order
Business analytics and margins
Revenue, net profit, average margin and ROI; capital in stock, % sold, average days-to-sell and recovery. Plus top brands, profit by platform, size and condition, and the monthly trend.
- Average margin and ROI of the business
- Profit by platform, size and condition
- Top brands by profit
- Revenue and profit trend by month
Stories generator, $0 of AI on images
The engine builds the day's posts (concept, copy, hashtags and prompts) and the stories generator hands back the Instagram story with Kutsuya's identity ready. Drop the pair's photo and out come the background, price and shipping. You generate the images in your own Ideogram, so image AI costs you $0.
- Brand-ready stories template
- Concept, copy, hashtags and prompts of the day
- Images in your own Ideogram, $0 AI
- From inventory to story, in the same panel
Our five steps applied to a real project.
Process
- 01Wk 1
Discovery
Session with Kutsuya: how they log in the sheet today, what each pair carries, which brands and sizes they handle, how they post on Instagram. The map of the operation that later becomes the panel.
- Map of the current spreadsheet
- Catalog of brands, sizes and statuses
- 02Wk 1-2
Identity + data model
We defined Kutsuya's visual DNA (immersive wine, Japanese 靴屋) and the per-pair data model: which fields are questions, which auto-fill from the link, and how the accounting (cost, profit, margin, ROI) is computed.
- Brand DNA (wine / Japanese)
- Data model + accounting rules
- 03Wk 2-3
Panel build
Inventory with the registration wizard and per-pair accounting, a KPI dashboard and the Analytics section. All on local JSON data, with no cloud database.
- Inventory + per-pair accounting
- KPI dashboard and Analytics
- 04Wk 3-4
Content + stories
The content engine builds the day's posts (concept, copy, hashtags, prompts) via Vercel AI Gateway, and the stories generator hands back the branded story. Images are generated in your Ideogram, so image AI costs $0.
- Content engine (prompts-only)
- Brand-ready stories generator
- 05Ongoing
Operation
Kutsuya runs from the panel: logs pairs by answering, reviews margins and capital, and posts stories. We tune catalogs (brands, sizes) and metrics against real usage.
- Panel in daily operation
- Tuned catalogs and metrics
- 01Wk 1
Discovery
Session with Kutsuya: how they log in the sheet today, what each pair carries, which brands and sizes they handle, how they post on Instagram. The map of the operation that later becomes the panel.
- Map of the current spreadsheet
- Catalog of brands, sizes and statuses
- 02Wk 1-2
Identity + data model
We defined Kutsuya's visual DNA (immersive wine, Japanese 靴屋) and the per-pair data model: which fields are questions, which auto-fill from the link, and how the accounting (cost, profit, margin, ROI) is computed.
- Brand DNA (wine / Japanese)
- Data model + accounting rules
- 03Wk 2-3
Panel build
Inventory with the registration wizard and per-pair accounting, a KPI dashboard and the Analytics section. All on local JSON data, with no cloud database.
- Inventory + per-pair accounting
- KPI dashboard and Analytics
- 04Wk 3-4
Content + stories
The content engine builds the day's posts (concept, copy, hashtags, prompts) via Vercel AI Gateway, and the stories generator hands back the branded story. Images are generated in your Ideogram, so image AI costs $0.
- Content engine (prompts-only)
- Brand-ready stories generator
- 05Ongoing
Operation
Kutsuya runs from the panel: logs pairs by answering, reviews margins and capital, and posts stories. We tune catalogs (brands, sizes) and metrics against real usage.
- Panel in daily operation
- Tuned catalogs and metrics
The numbers the project left behind in production.
What changed
Paste the GOAT/StockX/Grailed link and it auto-fills; you only answer what's missing, step by step. No hunting for the right cell.
Every pair computes its own accounting; capital in stock and receivables are visible in the same table.
The system builds concept, copy and prompts; you generate images in your own Ideogram. The text AI costs cents; images, $0.
Inventory and content live on the client's own machine (local JSON). If an outside service goes down, the operation keeps running.
Screens of the site in production.
How it looks


The technologies that sustain the operation.
Technologies
- Next.js
- TypeScript
- Tailwind CSS v4
- Motion
- JSON local
- Zod
- Drizzle
- Vercel AI Gateway
- Modo solo-prompts
- Vercel Cron
Want something like this for your business?
If this case clicked for you, let's talk. We reply within one business day, no strings attached.